
As organizations collect more imagery, LiDAR, and spatial datasets than ever before, the challenge is no longer simply acquiring data—it’s transforming that data into clear, decision-ready insights. Traditional approaches often require exporting information into external BI tools, managing complex integrations, or relying on analysts to manually build dashboards.
FusionLens changes that.
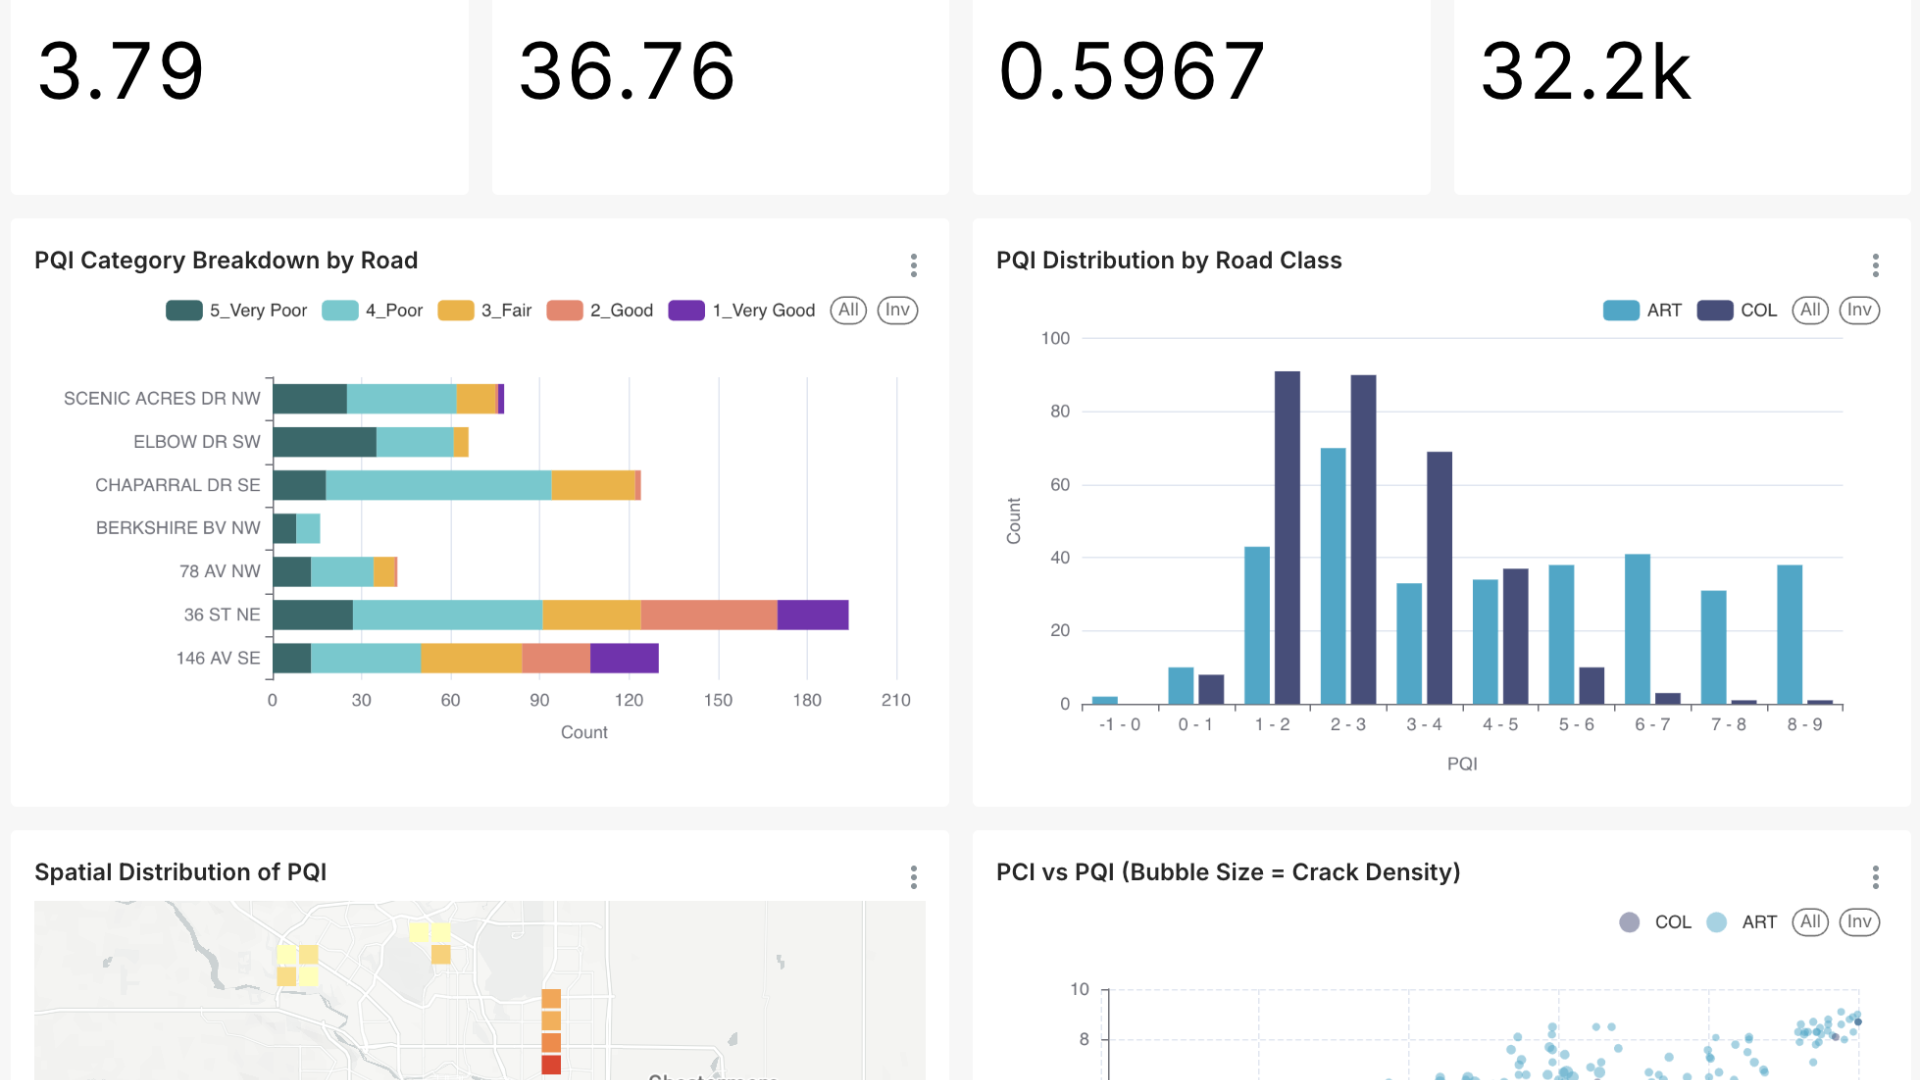
Built directly into FusionMap, FusionLens enables users to create charts, graphs, and analytical dashboards without leaving the geospatial environment they work in every day. It brings powerful, intuitive analytics to the locations and assets teams are already analyzing—bridging the gap between spatial understanding and operational decision-making.
Why FusionLens Matters
1. Analytics Where You Need Them Most
Instead of jumping between FusionMap and external reporting tools, FusionLens brings analysis directly into the map interface. Users can visualize trends, summarize measurements, and understand condition changes—all in the same platform where their spatial data lives.
2. No Additional Software Required
FusionLens replaces the need for costly BI tools such as Google Looker (~$300/user/year) or Tableau (~$420/user/year). Organizations gain enterprise-grade visual analytics without extra licensing, training, or integration work.
3. Purpose-Built for Geospatial Workflows
Unlike standalone dashboards, FusionLens is tightly integrated with FusionMap’s core features. This means:
Assets detected by AI can be summarized in dashboards
LiDAR-derived measurements can be analyzed instantly
Environmental or weather layers can be contextualized with operational metrics
Field updates from the iOS app can automatically feed into charts
This seamless integration accelerates decision cycles and keeps stakeholders aligned.
What Teams Can Do With FusionLens
FusionLens supports both high-level reporting and detailed operational analysis. Use cases include:
Asset Management
Track inventory counts, condition ratings, inspection frequencies, and maintenance timelines—all updated dynamically as new data arrives.
Transportation & Infrastructure
Summarize defect trends, pavement condition changes, and AI detections to prioritize repairs and improve long-term planning.
Disaster Response
Generate dashboards that compare pre- and post-event conditions, monitor response progress, and communicate findings clearly to stakeholders.
Mining Operations
Monitor pit expansion, haul road conditions, or terrain changes through visual analytics, helping teams maintain safety and compliance.
Geohazard Monitoring
Blend dashboard visuals with LiDAR-derived insights—such as slope changes or elevation shifts—to support mitigation strategies.
A More Efficient Way to Communicate Insights
FusionLens ensures that technical insights are not locked behind specialized software. Engineers, planners, inspectors, and leadership can all access the same dashboards inside FusionMap, enabling:
Clearer communication across teams
Faster validation of observations
Simplified reporting for stakeholders
Improved transparency for project owners
Because FusionLens is embedded within FusionMap, dashboards remain tied directly to the underlying geospatial context—something no external BI tool can replicate.
FusionLens: Visual Intelligence for a Data-Driven Future
Geospatial data is only as valuable as the decisions it empowers. FusionLens transforms complex datasets into accessible, high-impact visuals that help teams act with confidence. With no extra software costs, no complicated integrations, and a design that aligns with the realities of geospatial work, FusionLens gives organizations a smarter, more efficient path to insight.





Comments are closed