
Smarter Transportation Starts With Smarter Maps
30+
Major Projects
125k
Miles Analyzed
$5bn
Project Values
50k
Hours Saved
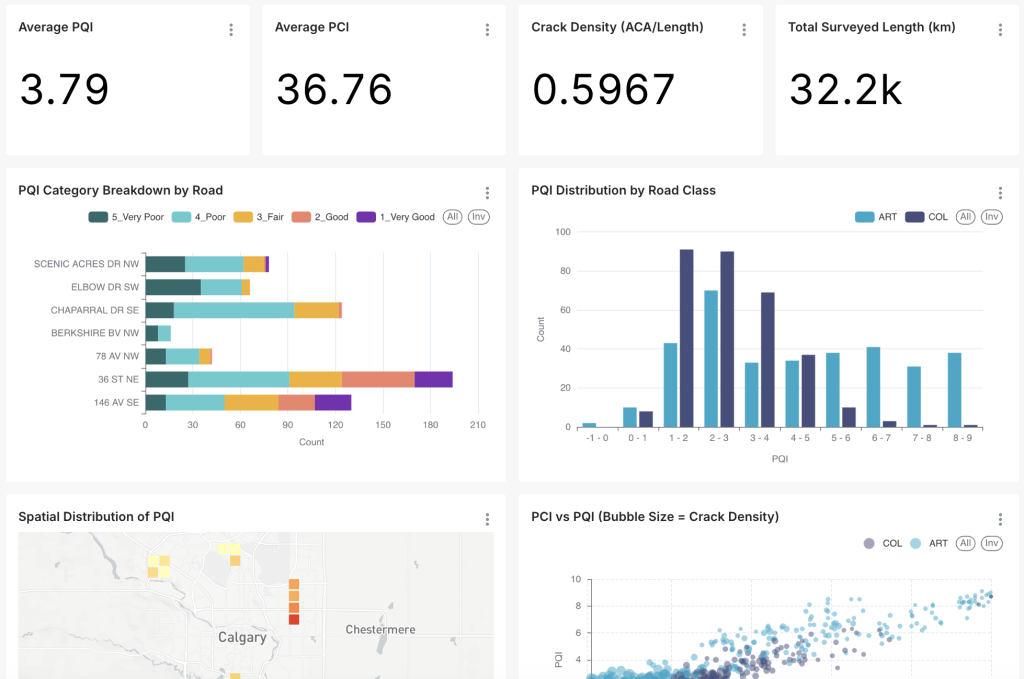
Gain deeper insights with FusionLens Dashboard
FusionLens turns complex geospatial data into intuitive, real-time insights displayed through an interactive dashboard.
- Monitor performance, usage, and data activity in one unified view
- Discover patterns and make smarter, data-backed decisions instantly
Decision-Makers Platform
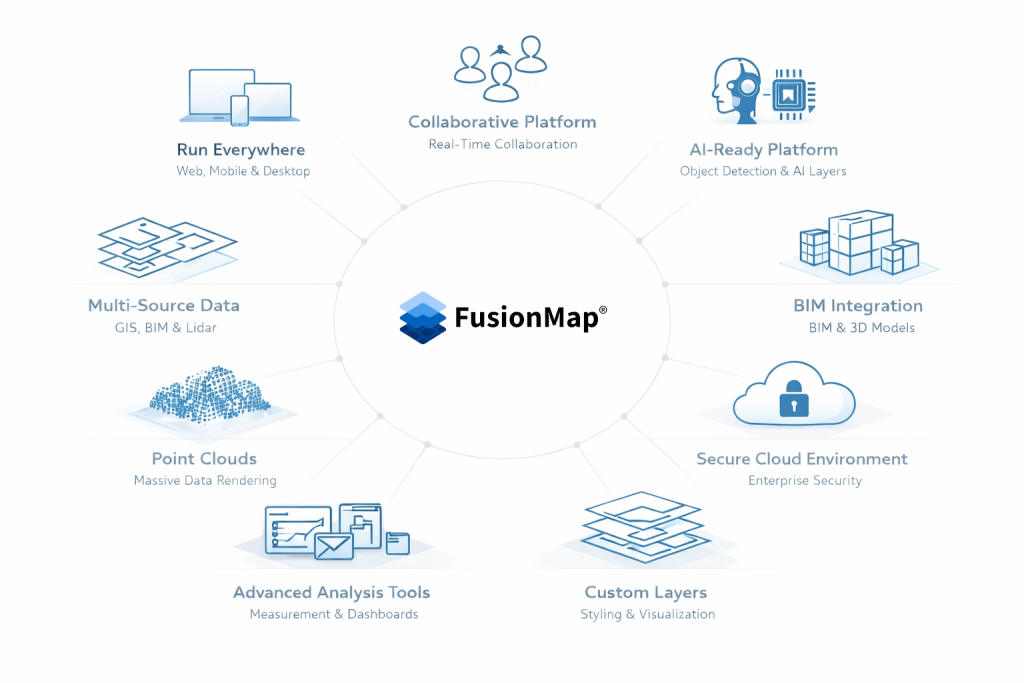
A centralized platform that turns complex geospatial data into clear, actionable insights for confident decision-making.
- A secure, collaborative geospatial platform that runs everywhere
- Cut through complexity with intuitive tools that surface what matters most
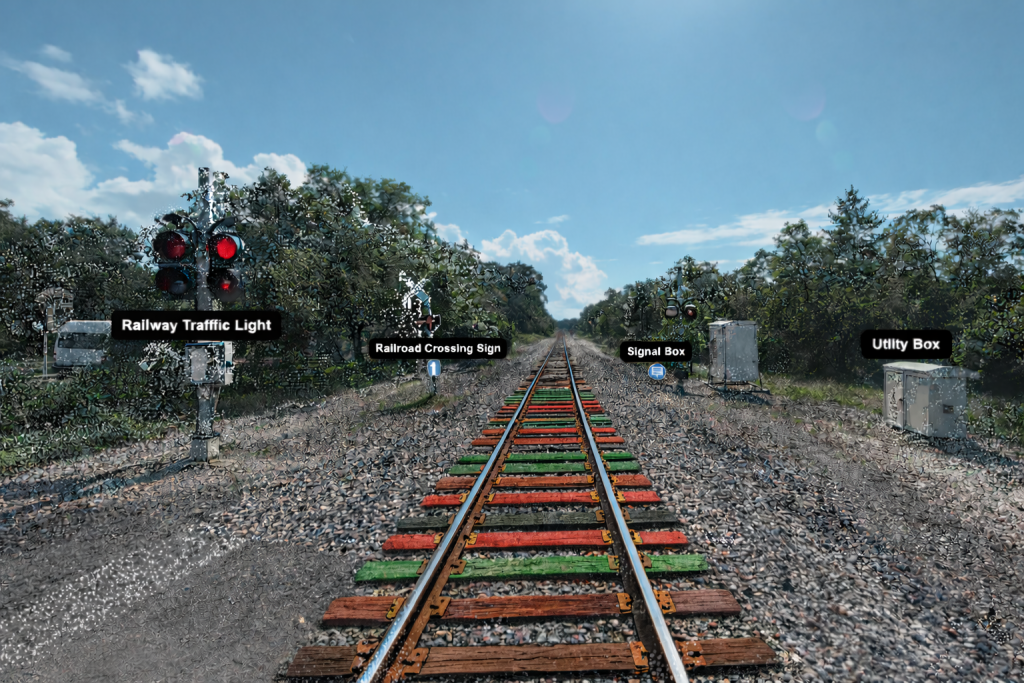
AI Driven Asset Inventories
Automatically detect and map signs, poles, manholes, markings, and more, reducing manual survey time and improving asset accuracy.
- Faster, more complete asset inventories
- Reduced reliance on manual field crews
- Consistent condition assessment across networks
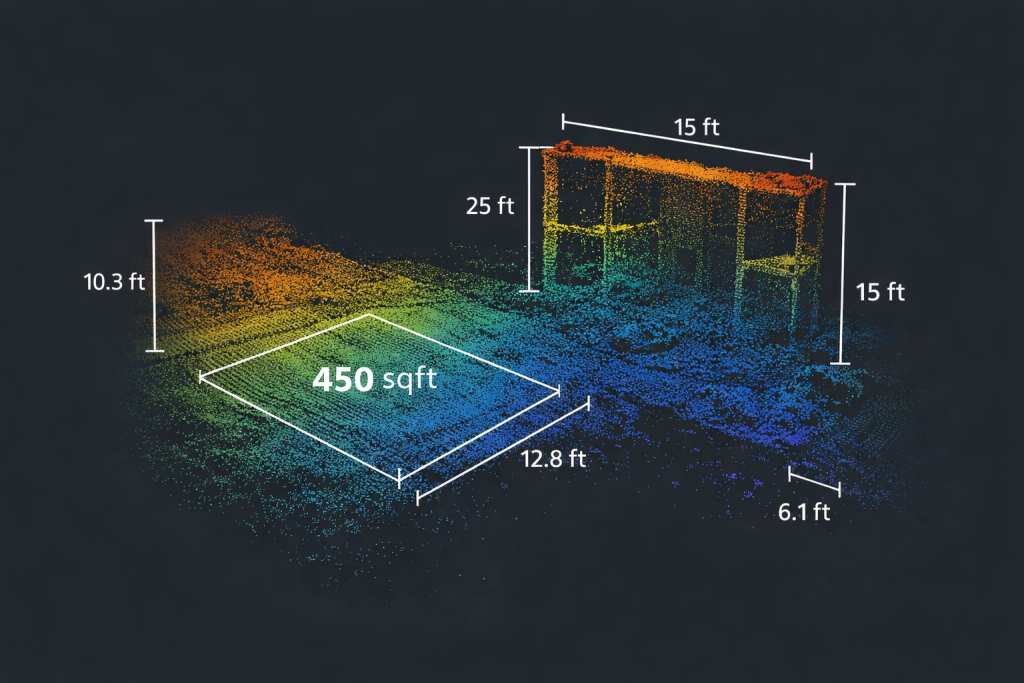
Efficient Corridor Inspections
Field teams no longer need to revisit sites for measurements or verification. FusionMap allows users to analyze corridors directly through imagery and LiDAR, capturing distances, elevations, slopes, and clearances from the office.
- Faster, more complete asset inventories
- Reduced reliance on manual field crews
- Consistent condition assessment across networks
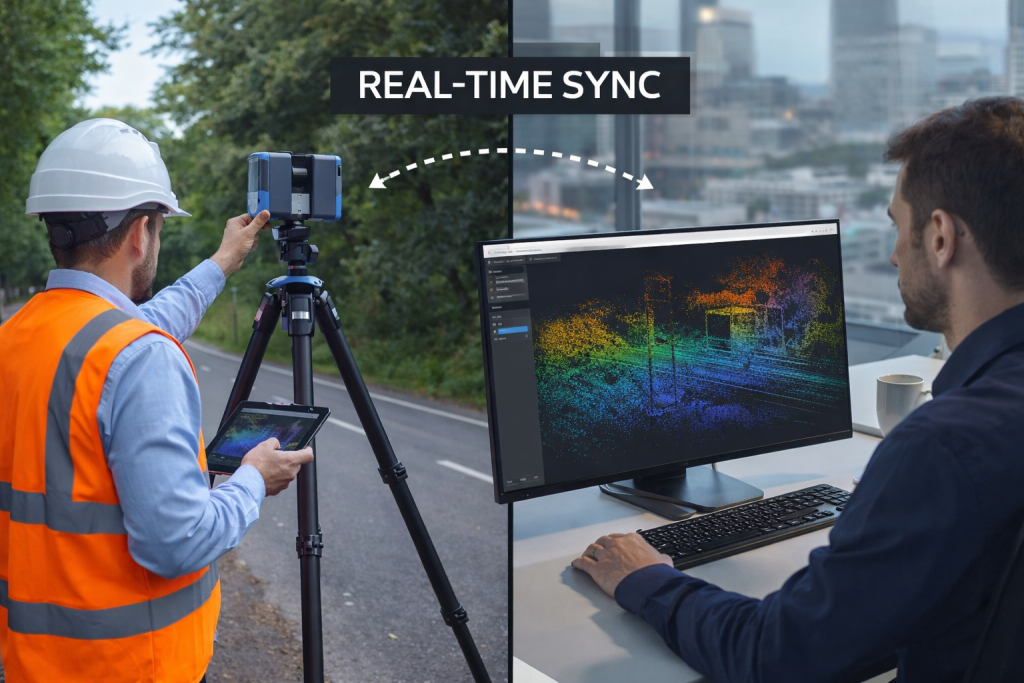
Connected Field–Office Workflows
With FusionMap’s mobile app, field teams capture images, notes, and updates that sync instantly to the office. Large datasets, such as extensive roadway LiDAR scans, upload seamlessly through FusionMap’s Fusion Cloud.
- Real-time coordination between inspectors and analysts
- Fewer delays caused by data transfer
- Clear documentation for all stakeholders
Change Detection for Monitoring & Maintenance
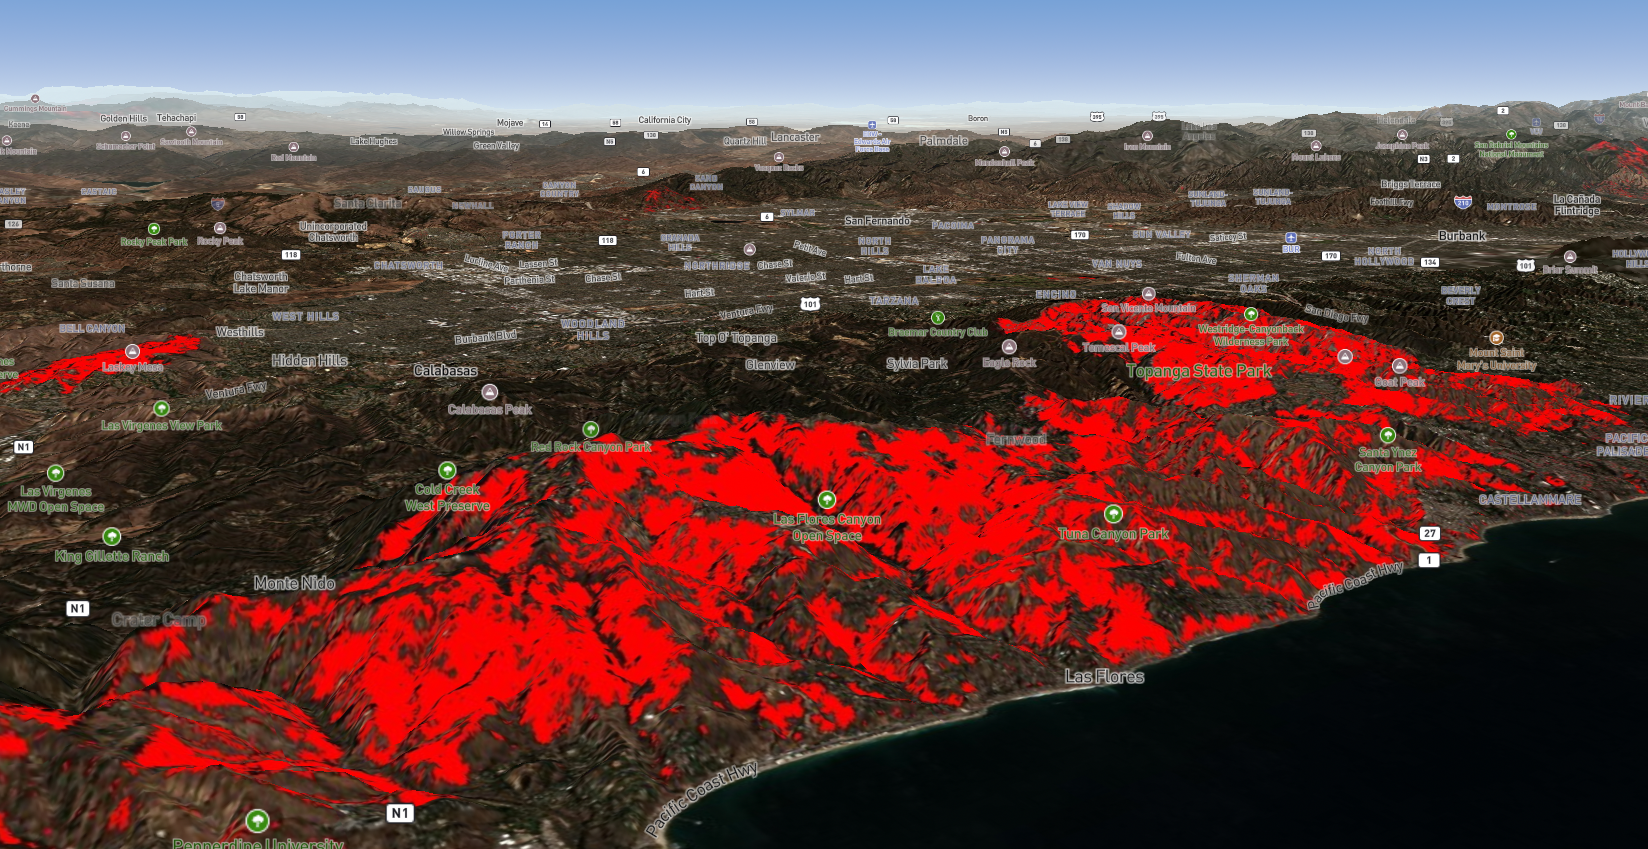
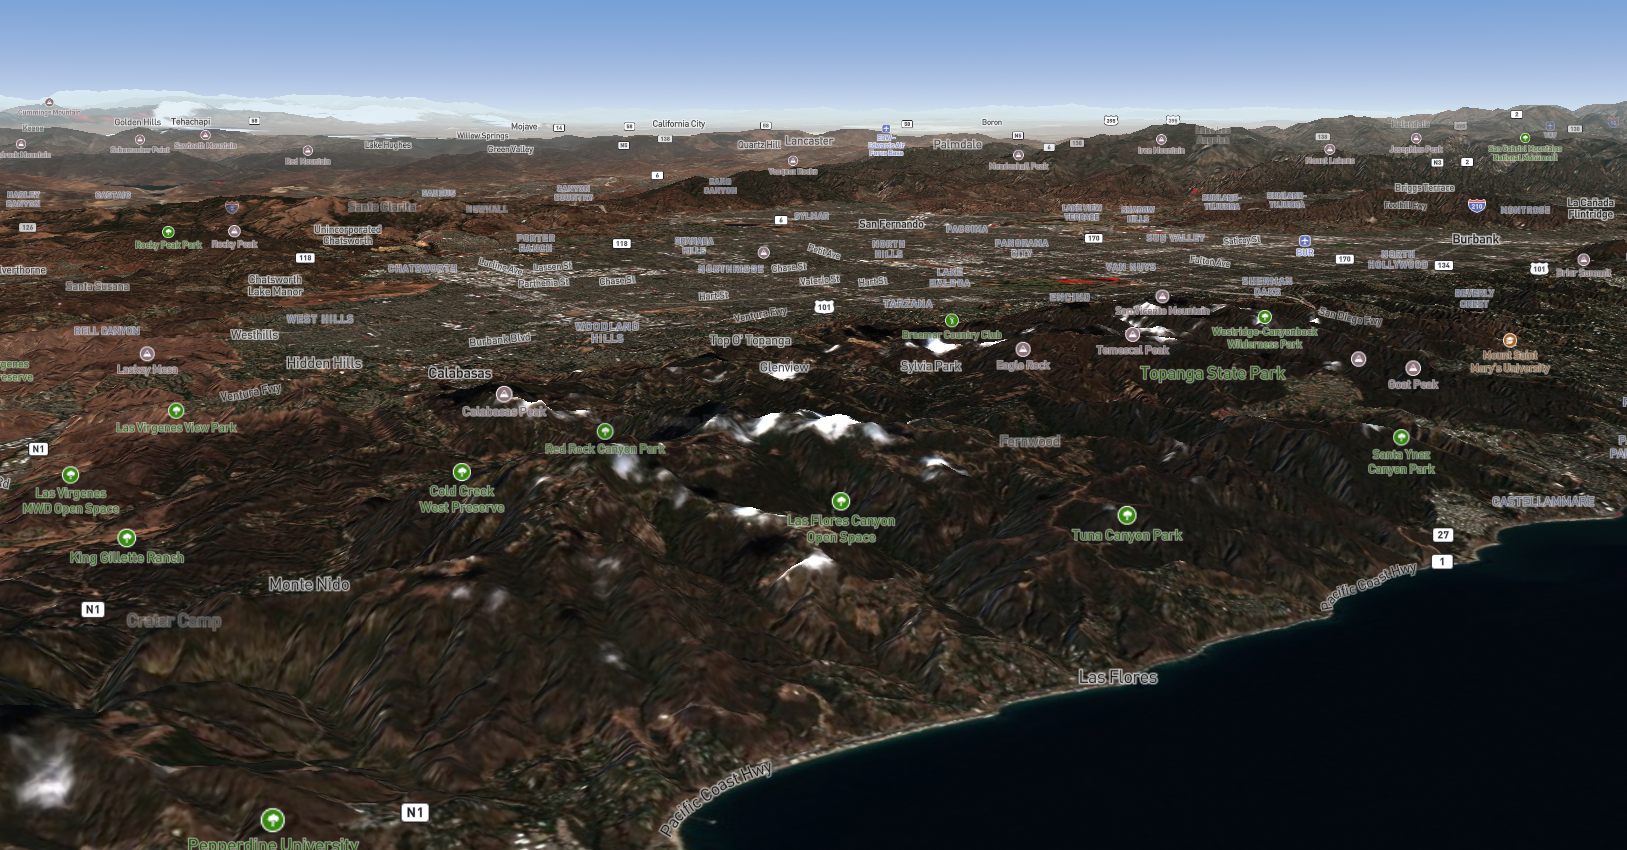
Whether assessing disaster damage, tracking construction progress, or reviewing pavement conditions, FusionMap makes comparisons simple. Split View allows teams to analyze two datasets side-by-side with an intuitive slider.
- Visual documentation of deterioration over time
- Faster post-event assessments
- Quick validation of repair work
Smart Planning & Network Optimization
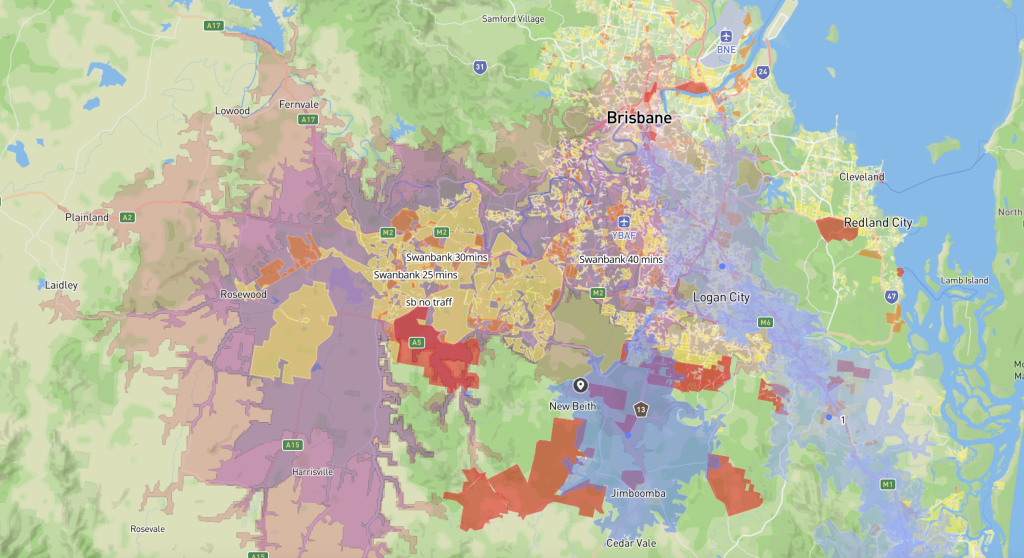
FusionMap supports transportation planners with modeling tools and enriched geospatial layers. Users can generate isochrones to analyze travel times, evaluate service coverage, and visualize trends through built-in dashboards.
- Strategic placement of transit stops or stations
- Emergency routing and response-time modeling
- Data-driven investment planning
Have a question?
Whether you’re curious about FusionMap, want to schedule a demo, or discuss how it could support your workflows, we’re here to help.
Fill out the form on the right and share a bit about what you’re looking for. Our team will review your message and reach out shortly to continue the conversation.

FusionMap transforms complex data into meaningful maps that make insights easy to explore and share.





Designed with ❤️ by Moosh.